
I first want to say thanks to CyberWarDog for his fantastic lab walk through for setting up a Threat Hunting Lab. It is hands down the best guide I have read to getting started with Threat Hunting. I followed his guide and got my lab completely setup. I then decided that Elastalert would be pretty nice for getting some of the highly likely IOC’s sent off to a security team for further analysis. This post will guide you through setting up Elastalert to get notifications when certain actions are logged.
This guide assumes you have gone through all parts of CyberWarDogs tutorials: https://cyberwardog.blogspot.com/2017/02/setting-up-pentesting-i-mean-threat.html
Not required, but it also assumes that you have set up Enhanced Powershell Logging so that we can begin to capture useful PowerShell data. https://cyberwardog.blogspot.com/2017/06/enabling-enhanced-ps-logging-shipping.html
Also not required but useful for this guide: A Slack Channel.
Cool, ready to go?
- SSH or Console into your Ubuntu server running your ELK stack.
- Download Elastalert from Yelp’s GitHub.
git clone https://github.com/yelp/elastalert
- Copy Elastalert to ‘/etc/’
sudo cp -r elastalert /etc/
- Change directory into your new Elastalert directory.
cd /etc/elastalert
- If not already installed, install pip.
sudo apt install python-pip
- Install Elastalert
pip install elastalert
- Install ElasticSearch-py
pip install elasticsearc=5.0.0
- Install dependencies:
pip install -r requirements.txt
- Lets make a directory for our Elastalert templates:
sudo mkdir templates
- Change directory into our new templates directory
cd templates
- Create a new template for monitoring commands executed:
sudo nano cmd_template.yaml
Paste:
es_host: localhost
es_port: 9200
name: "PLACEHOLDER"
index: winlogbeat-*
filter:
- terms:
    event_data.CommandLine: ["PLACEHOLDER"]
type: any
alert:
- slack
slack_webhook_url: "SLACK_WEB_HOOK"
es_host: This is the host your ELK stack is running on.
es_port: This is the port Elastic Search is listening on.
index: This is the index you setup with CyberWarDog’s blog.
filter: This is tell Elastalert to filter its search, in this case, we are filtering with ‘terms’ and we are looking for ‘event_data.CommandLine’ that equals whatever we put in place for PLACEHOLDER.
type: This means that Elastalert should alert on an matches that our Filter hits. We could also specify this Type to alert on new values identified, a spike in certain logs, a lack of logs and a bunch of other cool things.
alert: This tells elastalert how to alert you! There are a bunch of ways to get these alerts and I chose Slack for its simplicity to set up and use. For more options you can visit: http://elastalert.readthedocs.io/en/latest/ruletypes.html#alerts
- Create a new template for monitoring powershell commands executed:
sudo nano powershell_template.yaml
Paste:
es_host: localhost
es_port: 9200
name: "PLACEHOLDER"
index: winlogbeat-*
filter:
- terms:
    powershell.scriptblock.text: ["PLACEHOLDER"]
type: any
alert:
- slack
slack_webhook_url: "SLACK_WEB_HOOK"
- Create your main config.yaml file.
cd ..
sudo nano config.yaml
Paste:
rules_folder: alert_rules
run_every:
seconds: 30
buffer_time:
seconds: 60
es_host: localhost
es_port: 9200
alert_time_limit:
days: 1
writeback_index: elastalert_status
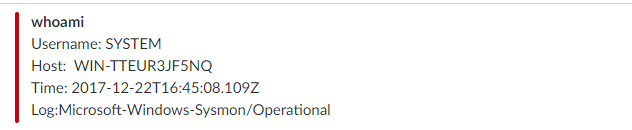
alert_text: "Username: {0} \nHost: {1} \nTime: {2} \nLog:{3}"
alert_text_type: alert_text_only
alert_text_args: ["user.name","host", "@timestamp","log_name"]
To change the body of the alert, you can modify the last three lines, you can add or remove attributes to include in your report. https://elastalert.readthedocs.io/en/latest/ruletypes.html#alert-content
- Create our Rules directory:
sudo mkdir alert_rules
cd alert_rules
- Copy our templates here:
sudo cp ../templates/* .
- Make copies of our templates.
cp cmd_template.yaml cmd_whoami.yaml
cp powershell_template.yaml powershell_invoke_webrequest.yaml
- Modify cmd_whoami.yaml to alert when whoami is executed.
sudo nano cmd_whoami.yaml
- Replace the PLACEHOLDER text in both locations with ‘whoami’, you can also copy this file many times over to alert on multiple commands ran.
es_host: localhost
es_port: 9200
name: "whoami"
index: winlogbeat-*
filter:
- terms:
 event_data.CommandLine: ["whoami"]
type: any
alert:
- slack
slack_webhook_url: "SLACK_WEB_HOOK"
- Replace SLACK_WEB_HOOK with your Slack Web Hook. https://get.slack.help/hc/en-us/articles/115005265063-Incoming-WebHooks-for-Slack
- Modify powershell_invoke_webrequest.yaml to alert when Invoke-WebRequest is executed.
sudo nano powershell_invoke_webrequest.yaml
- Replace the first Placeholder with ‘Invoke-WebRequest’ and the second Placeholder with “invoke”, “webrequest”.
- Replace SLACK_WEB_HOOK with your Slack Web Hook. https://get.slack.help/hc/en-us/articles/115005265063-Incoming-WebHooks-for-Slack
es_host: localhost
es_port: 9200
name: "invoke-webrequest"
index: winlogbeat-*
filter:
- terms:
    powershell.scriptblock.text: ["webrequest"]
type: any
alert:
- slack
slack_webhook_url: "SLACK_WEB_HOOK"
Only query lowercase terms.
- Remove the two template files we copied over:
sudo rm *template.yaml
- Run elastalert-create-index and follow the prompts
elastalert-create-index
Remember: You host is localhost and your port is 9200, if you followed CyberWarDog’s guide, you also do not have authentication set up for ElasticSearch (You used nginx instead) so leave username and password empty. You also don’t have SSL or TLS setup.
- Change directory back to /etc/elastalert
cd /etc/elastalert
- Run elastalert –verbose
elastalert --verbose
- Go to your Windows machine running winlogbeat and open up your command prompt.
- Enter whoami and monitor your slack.
whoami
- Profit
Commands you may want to monitor for:
Whoami

Netstat

Wmic
Powershell Functions you may want to monitor on:
Invoke-WebRequest

Invoke-Obfuscation

Downloadstring

Invoke-ShellCommand
If you are going to take this Threat Hunting thing seriously, you will most likely want to add alerts for Spikes, Frequency, Cardinality and a billion other types of things that are good ideas to check for with any Production system.
For comments, questions, concerns you can reach me at Twitter or via Email
[UPDATE: Several issues fixed 12/26]