
![]()
Threat hunting on Linux and Mac has probably never been easier. With the combination of these tools, we can query all of our hosts on demand for IOC’s, schedule queries to run on an automated basis and feed all of these results into our SIEM. Osquery is even platform agnostic so we can deploy it across all endpoints, regardless of host OS.
Osquery – Is a tool that allows us to query devices as if they are databases. It was built by Facebook and is built with performance in mind.
Kolide Fleet – A flexible control server for osquery fleets. Fleet allows us query multiple hosts on demand as well as create query packs, build schedules and manage the hosts in our environment.
Elastic Stack – Elasticsearch, Logstash and Kibana are tools that allow for the collection, normalizing and visualization of logs.
This post will assume a couple of things:
- You have an Elastic Stack configured. This has most likely never been easier, simply check out Roberto Rodriguez’s HELK (Hunting ELK) and run the setup script. For this post, I am using HELK so it should be all you need. If you like to do things manually so you understand how things are working, Roberto Rodriguez has you covered, head over to his site and follow his tutorials (They are top-notch).
What you will need:
- At least one Linux host to run your osquery daemon, you can also run it on the same box as you are running Kolide or your Elastic stack.
- An Ubuntu 16.04 Server to run Kolide Fleet, you can run this on the same box as your Elastic stack. This tutorial uses a separate host to run Kolide Fleet so I will let you know what you might need to change to make it work on the same server.
Before we begin, make sure to run:
apt update && apt upgrade
Kolide Setup:
You can use Kolides official documentation for most of this if you’d like. I basically customized their install guide to be more fitting for our purpose.
Install MySQL:
Use the password: ‘kolide’ (Or whatever you want, just adjust accordingly as you go)
Install and run Redis:
Or if you have time, use the proper procedure to run Redis although totally not necessary for the purpose of this guide!
Fleet Server Setup:
Now, if you go to https://localhost:8080 in your local browser, you should be redirected to https://localhost:8080/setup where you can create your first Fleet user account.
We need to create some queries now, you can do this with the GUI, or you can run the importer tool found here. The importer tool is a bit buggy so for the purpose of this post, we will just configure the queries manually.
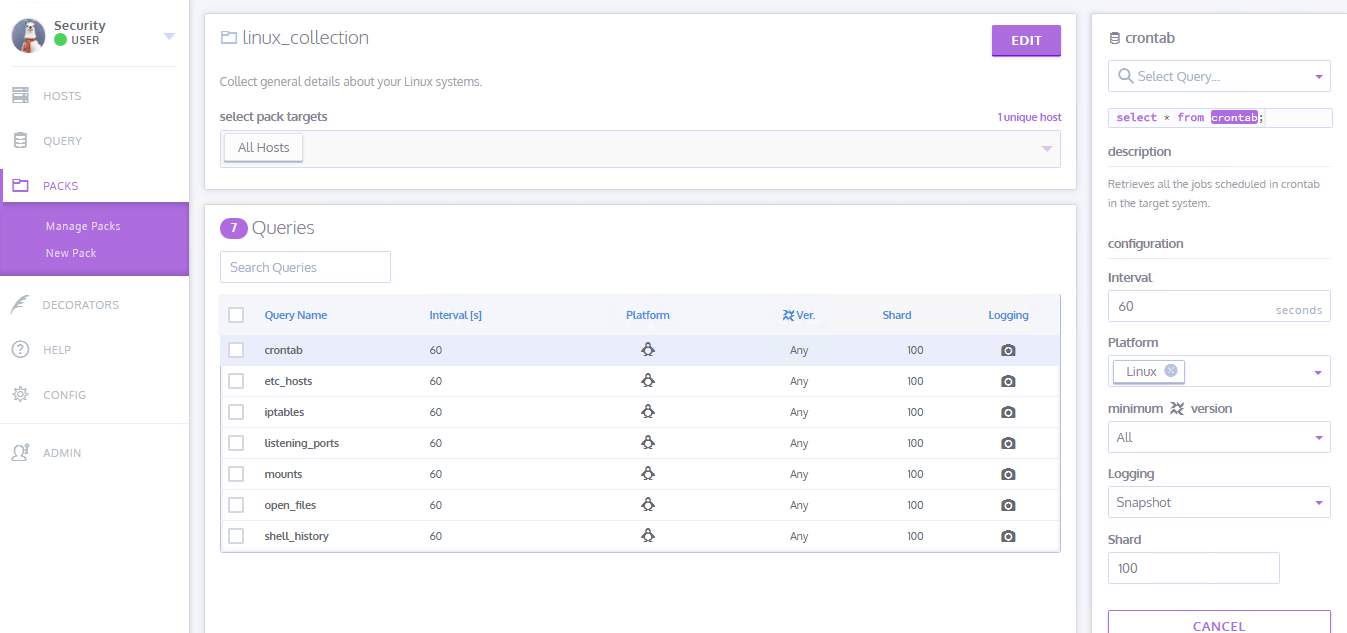
Go to Packs –> Manage Packs –> Create New Pack
Name the pack ‘linux_collection’ and add a description of you’d like. Under Select Pack Targets, choose All Hosts.
Now on the right hand side of the page, you should see Select Query. Click that drop down and choose ‘crontab’.
Set the interval to 60, the Platform to Linux, the minimum version to All and the Logging to Snapshot. Set the shard to 100.
The logging set to Snapshot will simply return all the results, differential would return the changes since the last query, and this is good for monitoring for malicious changes.
The shard is the percent of hosts that this Osquery pack will query. In a large environment, it might make sense to only query a portion of the hosts every time instead of all of them.
Repeat these steps for the following queries: etc_hosts, iptables, listening_ports, mounts, open_files, and shell_history..
All of these queries can be run on demand as well.
OSQuery Install:
Now on your Linux host we need to install OSQuery, like I mentioned in the beginning of the post, you can install this on the same machine that’s running Kolide, your Elastic stack or a standalone box.
Back on your new Kolide instance, select ‘Add New Hosts’ and copy the enroll Secret. Select Fetch Kolide Certificate and move certificate to your Linux box at /var/osquery/server.pem. Instead of using scp or the likes, you can simply open the certificate file with a text editor and copy/paste into you Linux terminal.
Now, back on the host that you are installing OSQuery, replace
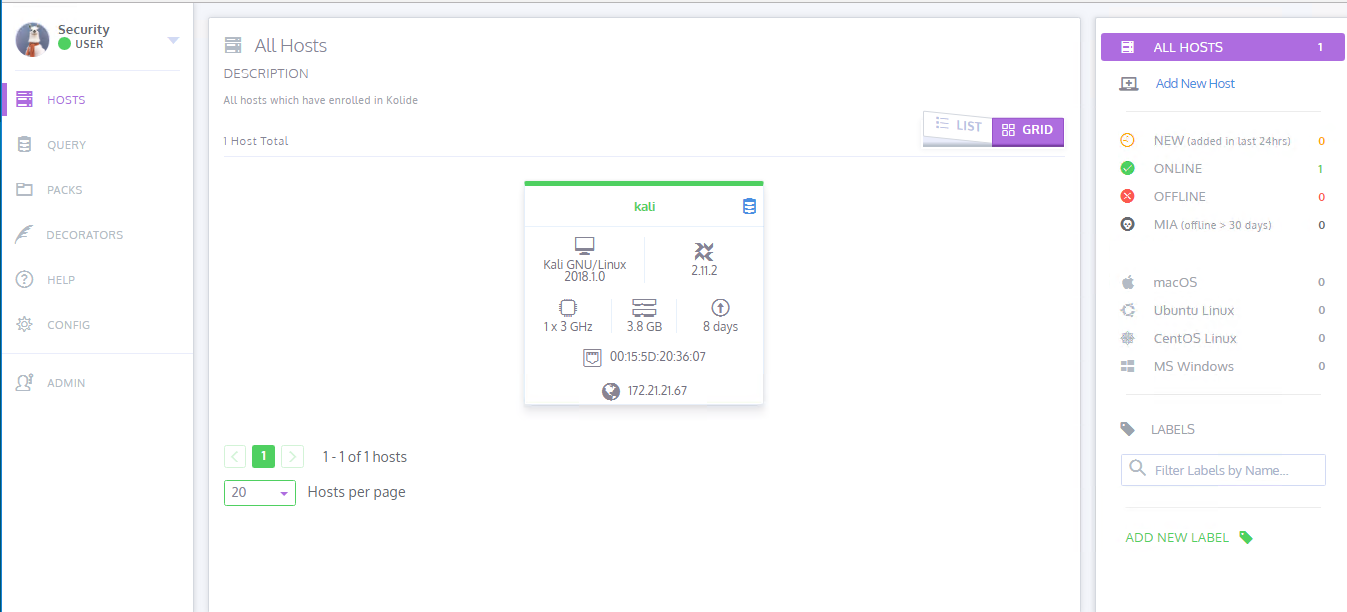
If you go back to you Kolide app, you should see your new host appear!
FileBeat Installation:
We need to use FileBeat to move our osquery logs over to our Elastic Stack. If you are running osquery on the same machine as your Elastic Stack, you don’t need FileBeat, you can simply use the Logstash file plugin to pull the logs from the log file and push them to Elasticsearch.
On the server running Kolide run:
In the filebeat config file paste the following:
On line: 31, update localhost with your Logstash server IP.
If you are using TheHELK out of the box, you will not need to configure the ssl.certificate_authorities, however, if you followed the manual ELK setup and/or would like to use an SSL cert to encrypt the log traffic, you will need to comment this line and add the cert that Logstash is using.
Now run:
service filebeat start
Logstash:
On you Elastic Stack server, or the server that Filebeat is forwarding osquery logs to, you will need to add some Logstash filters.
Add a new output filter:
sudo nano /etc/logstash/conf.d/60-osquery-output.conf
Replace ‘fleet-controller’ with the hostname of you Kolide server and paste this in to the conf file you just opened:
Kibana:
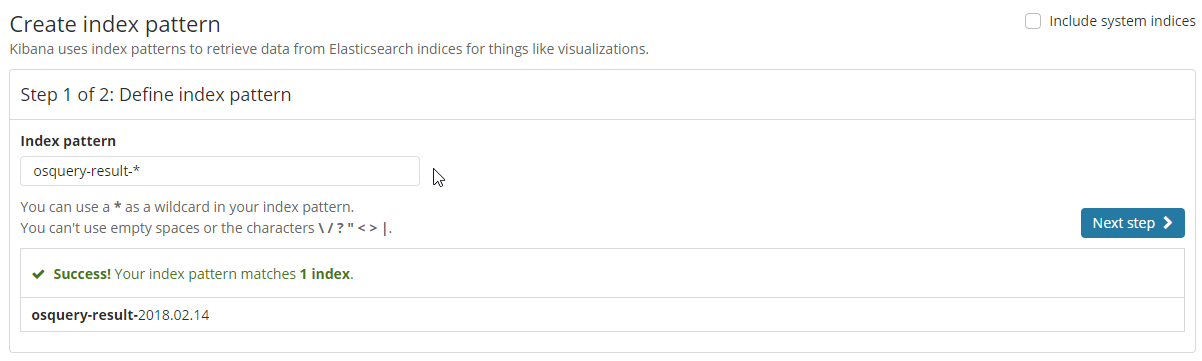
Choose Management -> Index Patterns -> Create Index Pattern
In the Index Pattern box, enter osquery-result-* and choose Next Step. From the Time Filter field name drop down, choose @timestamp and then choose Create index pattern.
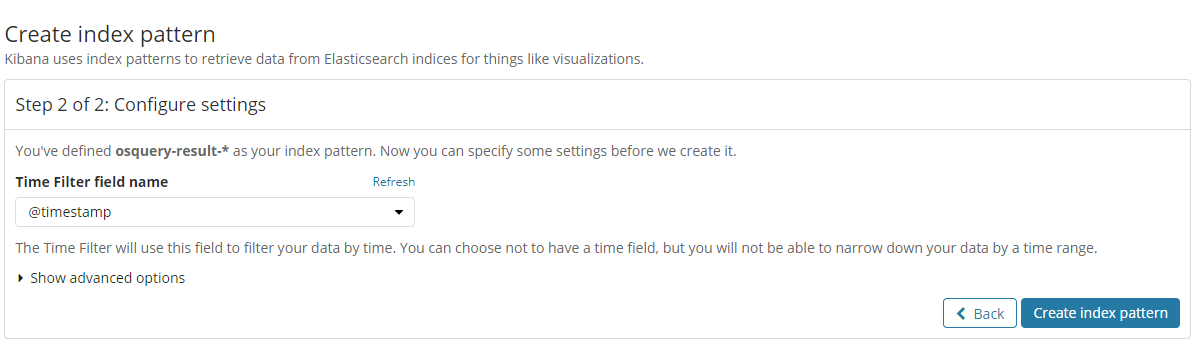
Now go to Discover and choose osquery-result-* from the Index dropdown. You should see your queries filter in.
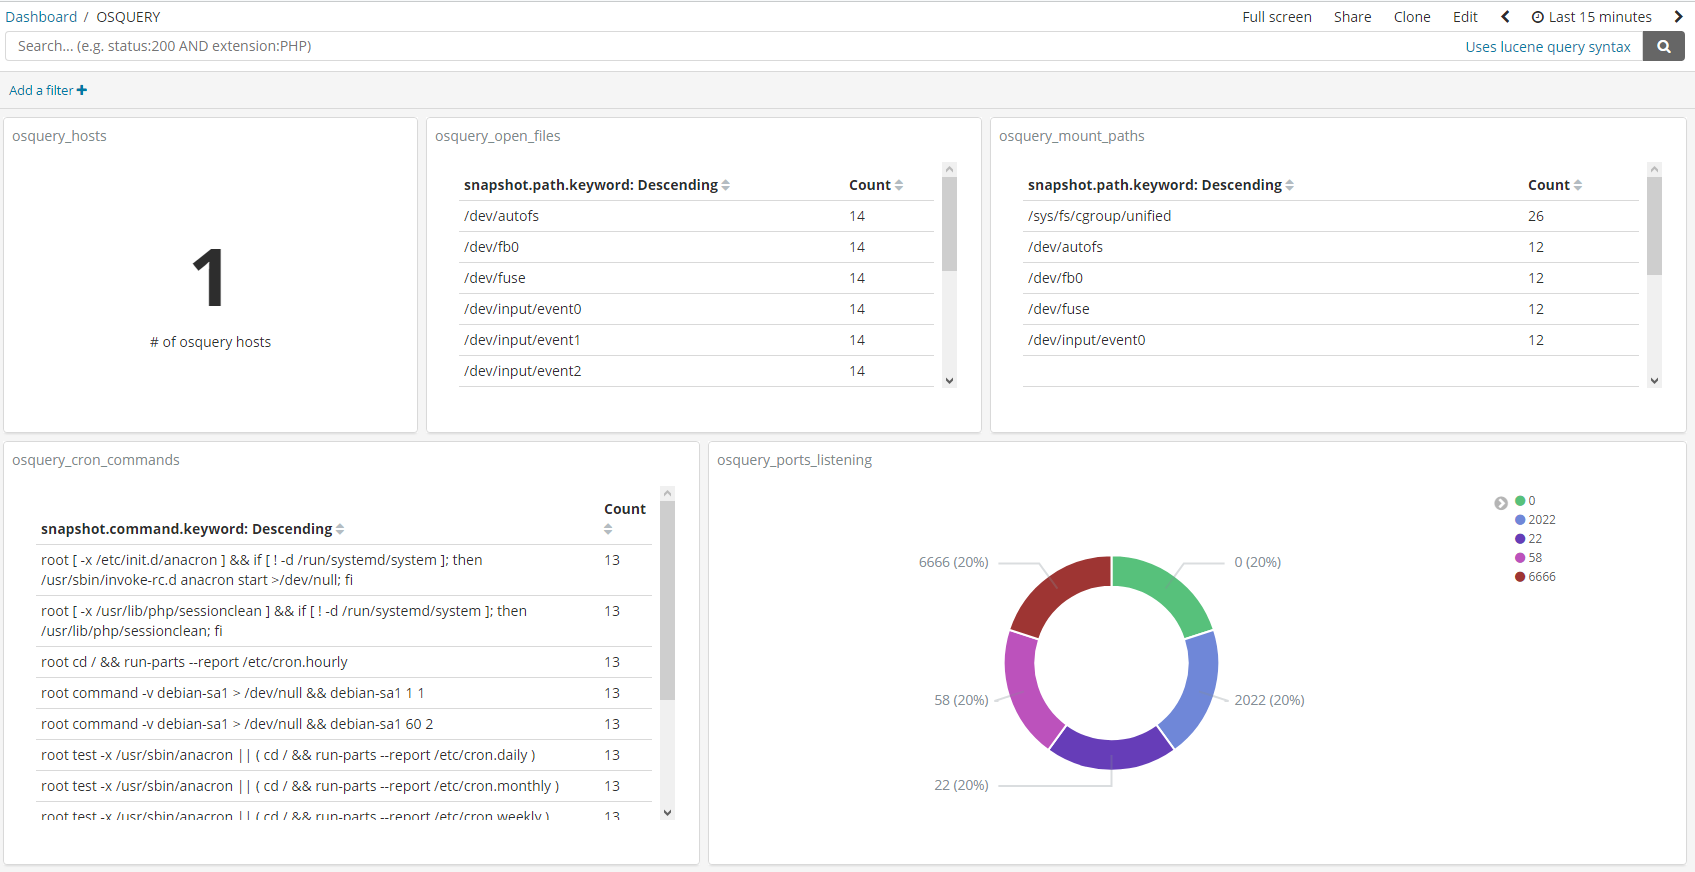
Go To Management -> Import and import the two files found in this gist. One is the visualizations and one is the dashboard for osquery.
Recap:
This was all done with free tools. Add in sysmon to the mix and you now have a comprehensive threat hunting platform and a rudimentary SIEM. Osquery has support for Windows as well allowing you to query every. single. host. in your environment in a matter of seconds. If you are security and need the support from other teams before you can roll it out, sell it to them. osquery isn’t just a security tool. Operations, helpdesk, compliance teams etc can all get value from this, and the best part? Its free!
Further Reading/Resources:
https://medium.com/@palantir/osquery-across-the-enterprise-3c3c9d13ec55
https://blog.kolide.com/monitoring-macos-hosts-with-osquery-ba5dcc83122d
https://medium.com/@clong/osquery-for-security-b66fffdf2daf
https://medium.com/@clong/osquery-for-security-part-2-2e03de4d3721
The osquery slack channel: https://osquery.slack.com is super active and helpful! Also, if you run into any issues, /var/log/ is your friend 😉
Comments, suggestions, concerns… feel free to reach out to me on Twitter or by email!
The advice and scripts contained and referenced in this point are provided with no warranty. As always, never blindly trust scripts off the internet.